I ran into a bit of a problem with my virtual desktop under certain workloads. Performance on CPU-intensive tasks was worse than what I was expecting based on the CPU and the number of dedicated cores for the VM. I further confirmed this issue when I was playing the recently released Death Stranding 2 via Proton on Steam. The GPU utilisation was persistently utilised at below 60% of maximum, which is clearly unoptimal and shouldn’t happen with the used pairing of cpu and graphics card (Ryzen 9 9900X, RTX 5070-ti). So in general, the issue manifested as lower than expected thread utilisation and output metrics during workloads, which initially lead me to believe something related to either scheduling or caching was causing stalls.
CCD & CPU Affinity
My first instinct was to verify that the VM was actually assigned the correct cores/threads, and to make
sure that it had priority access to them for scheduling.
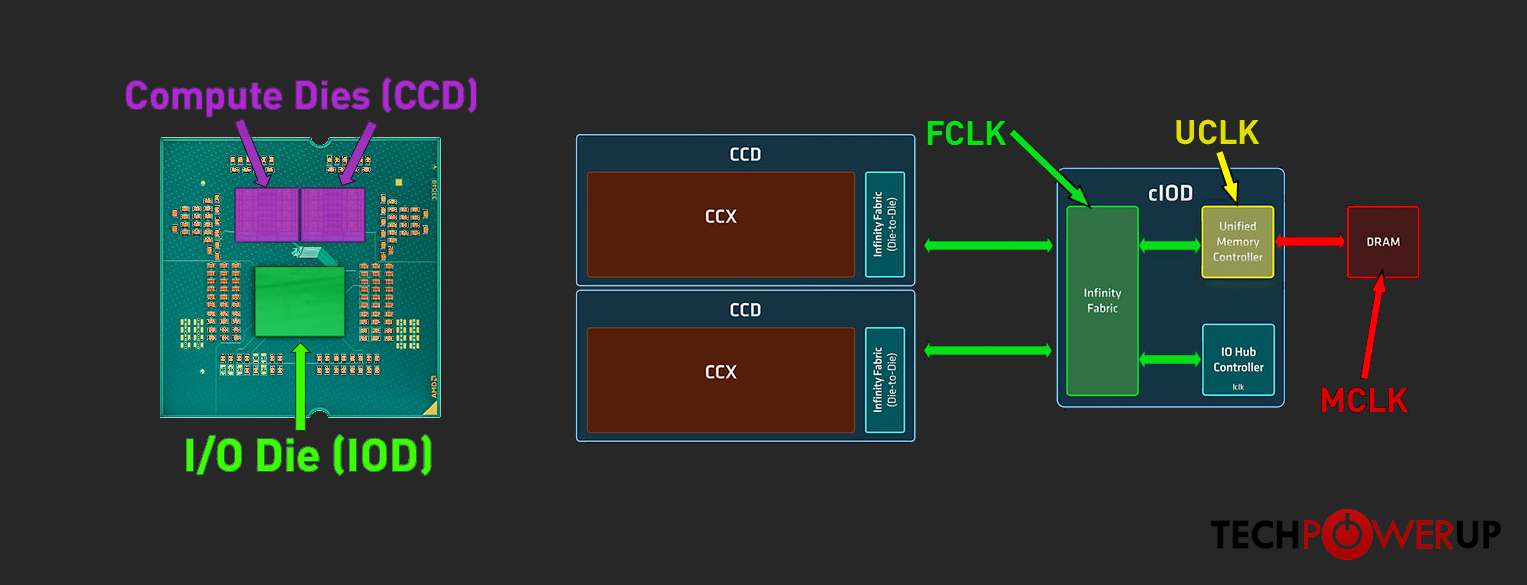
As the Ryzen 9 9900X uses a two Core Complex Die (CCD) design, it’s rather important that the VM
be given cores/threads that are all on the same CCD to avoid potential latency issues stemming from the cache being split
between the CCDs. I was aware of this potential point of contention already when I was choosing the CPU, but I had
presumed that the “NUMA aware” flag in Proxmox would be smart enough to handle this allocation automatically,
and thus sort of handwaved the details away. Regardless, I went on to verify what the cpu numa layout was using lscpu, and then
cross-referenced those details with what top was showing for the VM process.
 1root@pve.lan.tbk.fi:~# lscpu
 2Architecture:                x86_64
 3  CPU op-mode(s):            32-bit, 64-bit
 4  Address sizes:             48 bits physical, 48 bits virtual
 5  Byte Order:                Little Endian
 6CPU(s):                      24
 7  On-line CPU(s) list:       0-23
 8Vendor ID:                   AuthenticAMD
 9  Model name:                AMD Ryzen 9 9900X 12-Core Processor
10    CPU family:              26
11    Model:                   68
12    Thread(s) per core:      2
13    Core(s) per socket:      12
14    Socket(s):               1
15    Stepping:                0
16    Frequency boost:         enabled
17    CPU(s) scaling MHz:      62%
18    CPU max MHz:             5662.0161
19    CPU min MHz:             613.9540
20    BogoMIPS:                8782.95
21    Flags:                   fpu vme de pse tsc msr pae mce cx8 apic sep mtrr pge mca cmov pat pse36 clflush mmx fxsr sse sse2 ht syscall nx mmxext fxsr_opt pdpe1gb rdtscp lm constant_tsc rep_good
22                              amd_lbr_v2 nopl xtopology nonstop_tsc cpuid extd_apicid aperfmperf rapl pni pclmulqdq monitor ssse3 fma cx16 sse4_1 sse4_2 movbe popcnt aes xsave avx f16c rdrand lahf
23                             _lm cmp_legacy svm extapic cr8_legacy abm sse4a misalignsse 3dnowprefetch osvw ibs skinit wdt tce topoext perfctr_core perfctr_nb bpext perfctr_llc mwaitx cpuid_fault
24                             cpb cat_l3 cdp_l3 hw_pstate ssbd mba perfmon_v2 ibrs ibpb stibp ibrs_enhanced vmmcall fsgsbase tsc_adjust bmi1 avx2 smep bmi2 erms invpcid cqm rdt_a avx512f avx512dq a
25                             dx smap avx512ifma clflushopt clwb avx512cd sha_ni avx512bw avx512vl xsaveopt xsavec xgetbv1 xsaves cqm_llc cqm_occup_llc cqm_mbm_total cqm_mbm_local user_shstk avx_vn
26                             ni avx512_bf16 clzero irperf xsaveerptr rdpru wbnoinvd cppc arat npt lbrv svm_lock nrip_save tsc_scale vmcb_clean flushbyasid decodeassists pausefilter pfthreshold avi
27                             c v_vmsave_vmload vgif x2avic v_spec_ctrl vnmi avx512vbmi umip pku ospke avx512_vbmi2 gfni vaes vpclmulqdq avx512_vnni avx512_bitalg avx512_vpopcntdq rdpid bus_lock_de
28                             tect movdiri movdir64b overflow_recov succor smca fsrm avx512_vp2intersect flush_l1d amd_lbr_pmc_freeze
29Virtualization features:
30  Virtualization:            AMD-V
31Caches (sum of all):
32  L1d:                       576 KiB (12 instances)
33  L1i:                       384 KiB (12 instances)
34  L2:                        12 MiB (12 instances)
35  L3:                        64 MiB (2 instances)
36# This is the relevant section
37NUMA:
38  NUMA node(s):              2
39  NUMA node0 CPU(s):         0-5,12-17
40  NUMA node1 CPU(s):         6-11,18-23
41#
42Vulnerabilities:
43  Gather data sampling:      Not affected
44  Ghostwrite:                Not affected
45  Indirect target selection: Not affected
46  Itlb multihit:             Not affected
47  L1tf:                      Not affected
48  Mds:                       Not affected
49  Meltdown:                  Not affected
50  Mmio stale data:           Not affected
51  Old microcode:             Not affected
52  Reg file data sampling:    Not affected
53  Retbleed:                  Not affected
54  Spec rstack overflow:      Mitigation; IBPB on VMEXIT only
55  Spec store bypass:         Mitigation; Speculative Store Bypass disabled via prctl
56  Spectre v1:                Mitigation; usercopy/swapgs barriers and __user pointer sanitization
57  Spectre v2:                Mitigation; Enhanced / Automatic IBRS; IBPB conditional; STIBP always-on; PBRSB-eIBRS Not affected; BHI Not affected
58  Srbds:                     Not affected
59  Tsa:                       Not affected
60  Tsx async abort:           Not affected
61  Vmscape:                   Mitigation; IBPB on VMEXIT
This output confirms the two node layout and that the enumeration for the CCDs is interleaved.
My goal is therefore to make sure the high-performance VM ideally only uses cores/threads from
either 0-5,12-17 or 6-11,18-23 ranges. I’d also want to make sure that the KVM process has high priority
on scheduling so other host processes steal as little cycles as possible.
Next logical step is to see what CPUs the active KVM process is currently using. So I went through the
active kvm processes by using ps -ef | grep "/usr/bin/kvm" and noted the process ID for my vdesk.
I then used top -p <ID> to inspect the active CPUs for the VM process using the P (Last Used SMP) field.
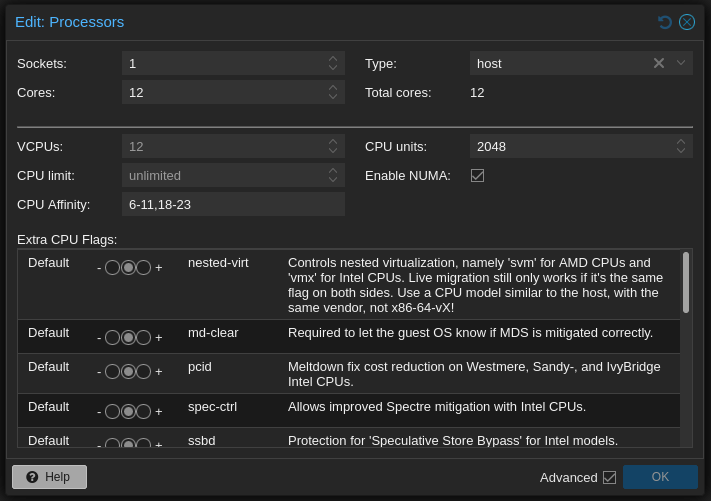
I noticed that the VM process was, in fact, using CPUs from both NUMA node ranges. I’m a little surprised by this, but to be fair, the flag is just called “Enable NUMA”. This doesn’t really mean anything concrete at face value, and I haven’t actually looked into what the option does under the hood, so fair enough –I’ll just specify the affinity manually.
I figure twelve threads is enough for this VM, allowing me to dedicate this second CCD entirely for the vdesk. This leaves the other CCD entirely for other virtual hosts, making sure that the high performance VM can’t possibly grind the whole hypervisor to a halt. I’ve also upped the CPU units weight for this VM higher, so the scheduler will prioritise this VMs needs within that CCD when appropriate. Meaning that it should still be safe enough to allow other VMs access to the CCD hardware if needed.
After making these changes and restarting the vdesk, I confirmed that the affinity setting was being utilised for scheduling as directed:
root@pve.lan.tbk.fi:~# top -p 56066
  PID   USER      PR  NI   VIRT   RES     SHR  S   %CPU     P
  56192 root      20   0   42.1g  53716   9980 S   4.0       7
  56182 root      20   0   42.1g  53716   9980 S   1.7       8
  56185 root      20   0   42.1g  53716   9980 S   1.3       9
  56186 root      20   0   42.1g  53716   9980 S   1.3      10
  56190 root      20   0   42.1g  53716   9980 S   1.3      21
  56187 root      20   0   42.1g  53716   9980 S   1.0      20
  56188 root      20   0   42.1g  53716   9980 S   0.7       6
  56193 root      20   0   42.1g  53716   9980 S   0.7       8
  56183 root      20   0   42.1g  53716   9980 S   0.3      18
  56184 root      20   0   42.1g  53716   9980 S   0.3      23
  56189 root      20   0   42.1g  53716   9980 S   0.3      19
  56191 root      20   0   42.1g  53716   9980 S   0.3      10
  56066 root      20   0   42.1g  53716   9980 S   0.0       6
  56067 root      20   0   42.1g  53716   9980 S   0.0       6
  56068 root      20   0   42.1g  53716   9980 S   0.0      19
  56069 root      20   0   42.1g  53716   9980 S   0.0      11
  56167 root      20   0   42.1g  53716   9980 S   0.0      18
  56195 root      20   0   42.1g  53716   9980 S   0.0      23
  56218 root      20   0   42.1g  53716   9980 S   0.0      21
  56219 root      20   0   42.1g  53716   9980 S   0.0      21
  56260 root      20   0   42.1g  53716   9980 S   0.0       7
 713924 root      20   0   42.1g  53716   9980 S   0.0       8
Huge Pages
And just because I was curious and at it, I decided to see if I could get hugepages working and active for this VM. Supposedly this may help with memory lookup speed by reducing the amount of entries in the TLB, which I imagine can conditionally provide better performance depending on the workload and how much total memory the system has. There’s a small benchmark article on the topic at RedHat Developers; but, I’m not about to run any benchmarks for this little demo since I’m just interested in seeing if I can get it to work for now.
To use the 1GiB hugepages the cpu should support pdpe1gb, so have a gander at
lscpu or cat /proc/cpuinfo for the available cpu features.
 1flags		: fpu vme de pse tsc msr pae mce cx8
 2            apic sep mtrr pge mca cmov pat pse36
 3            clflush mmx fxsr sse sse2 ht syscall
 4            nx mmxext fxsr_opt pdpe1gb rdtscp lm # <-- 'pdpe1gb'
 5            constant_tsc rep_good amd_lbr_v2 nopl
 6            xtopology nonstop_tsc cpuid extd_apicid
 7            aperfmperf rapl pni pclmulqdq monitor
 8            ssse3 fma cx16 sse4_1 sse4_2 movbe popcnt
 9            aes xsave avx f16c rdrand lahf_lm cmp_legacy
10            svm extapic cr8_legacy abm sse4a misalignsse
11            3dnowprefetch osvw ibs skinit wdt tce topoext
12            perfctr_core perfctr_nb bpext perfctr_llc
13            mwaitx cpuid_fault cpb cat_l3 cdp_l3 hw_pstate
14            ssbd mba perfmon_v2 ibrs ibpb stibp ibrs_enhanced
15            vmmcall fsgsbase tsc_adjust bmi1 avx2 smep bmi2
16            erms invpcid cqm rdt_a avx512f avx512dq adx smap
17            avx512ifma clflushopt clwb avx512cd sha_ni
18            avx512bw avx512vl xsaveopt xsavec xgetbv1 xsaves
19            cqm_llc cqm_occup_llc cqm_mbm_total cqm_mbm_local
20            user_shstk avx_vnni avx512_bf16 clzero irperf xsaveerptr
21            rdpru wbnoinvd cppc arat npt lbrv svm_lock nrip_save
22            tsc_scale vmcb_clean flushbyasid decodeassists
23            pausefilter pfthreshold avic v_vmsave_vmload
24            vgif x2avic v_spec_ctrl vnmi avx512vbmi umip
25            pku ospke avx512_vbmi2 gfni vaes vpclmulqdq
26            avx512_vnni avx512_bitalg avx512_vpopcntdq
27            rdpid bus_lock_detect movdiri movdir64b
28            overflow_recov succor smca fsrm avx512_vp2intersect
29            flush_l1d amd_lbr_pmc_freeze
Seems like my CPU supports it, so I followed the general guide for hugepages from Proxmox
by adjusting the kernel CMDLINE contents in /etc/default/grub. I’ve given vdesk 24GiB of RAM,
so I want at least 24 pages (each 1GiB).
1GRUB_CMDLINE_LINUX_DEFAULT="quiet amd_iommu=on iommu=on default_hugepagesz=1G hugepagesz=1G hugepages=26"
Curiously I couldn’t find a setting for enabling or configuring hugepages in the VM hardware configuration menu within the Web UI, so I manually added the line into the VM configuration.
 1root@pve.lan.tbk.fi:~# vim /etc/pve/qemu-server/114.conf
 2[...]
 3name: Hybrid
 4machine: q35
 5cores: 12
 6cpu: host
 7cpuunits: 2048
 8affinity: 6-11,18-23
 9hugepages: 1024        # <-- addition
10[...]
Lastly I ran update-grub ; proxmox-boot-tool refresh to make sure the new CMDLINE was pushed,
and then rebooted the machine.
After the reboot I started vdesk and checked current memory information from /proc/meminfo:
 1root@pve.lan.tbk.fi:~# grep -i huge /proc/meminfo
 2AnonHugePages:  33568768 kB
 3ShmemHugePages:        0 kB
 4FileHugePages:     49152 kB
 5HugePages_Total:      26
 6HugePages_Free:        2
 7HugePages_Rsvd:        0
 8HugePages_Surp:        0
 9Hugepagesize:    1048576 kB
10Hugetlb:        27262976 kB
This would indicate that that the VM was correctly given the 24GiB worth of hugepages for its memory space. Note that I overprovisioned the created pages on Proxmox because I’m not yet familiar with how the system actually behaves under the hood and if I need some extra or not.
Storage
The VM disk is currently on a Gen5 NVME SSD. There’s not much I can do to improve that, specially with the current hardware prices.
Conclusion and Performance Improvement
So good news and bad news. The good news being that the manual cpu affinity changes definitely improved performance across the board in basically all tasks, including the video game (see image below). Bad news is that I still can’t play my game, as there appear to be unresolved issues on Linux when using Blackwell cards and Proton in select titles.
But even with the issues, comparing the initial and final metrics side by side a few key details are evident. The CPU load distribution is far more uniform across the cores when running the video game, and the frametime graph shows far more consistent timing performance. To me this indicates that the changes were very successful.
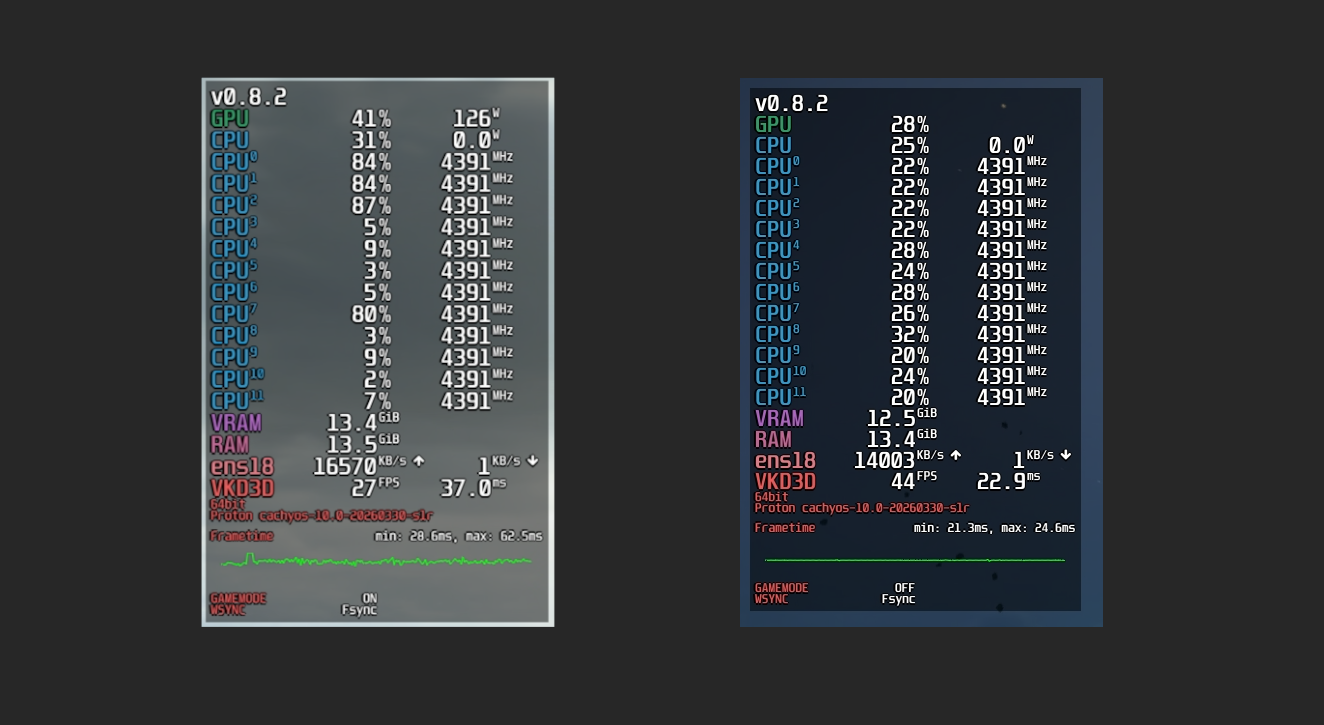
The low GPU usage quirk in DS2 is probably due to an issue in Nvidia drivers, Proton, or just the game itself. Other titles showed a similar (big) improvement in frametimes and more uniform CPU load, without the very low GPU utilisation issue.